
Name:
Date:
Read the table. Shade in the graph to show the same data.

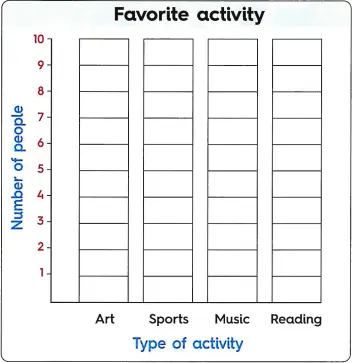
Use the graph to answer the questions.
a. Which activity is the most favorite ?
b. Which activity is the fewest favorite ?
c. How many students in all liked art and music ?
d. How many students in all liked sports and reading ?
e. How many students liked sports more than music ?
f. How many students in all liked sports and music ?