
Name:
Date:
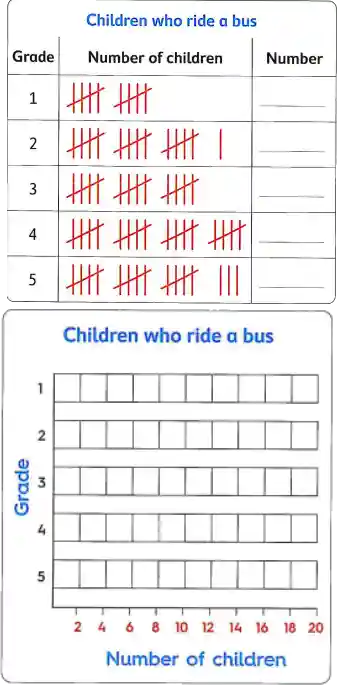
(1) Count the tallies. Write the total. Color the graph to show the data.
Answer the following questions :
a. How many children in grade 4 ride the bus to school ?
b. How many children in grade 3 ride the bus to school ?
c. Which grade has the most children who ride the bus ?
d. Which grade has the least children who ride the bus ?
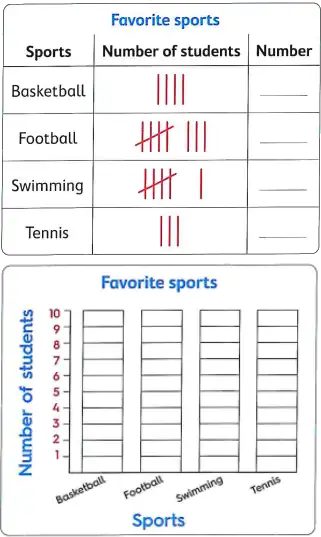
(2) Count the tallies. Write the total. Color the graph to show the data.
Answer the questions :
a. How many students did vote for football ?
b. Which sport is favored by the most ?
c. Which sport is favored by the least ?