Name:
Date:
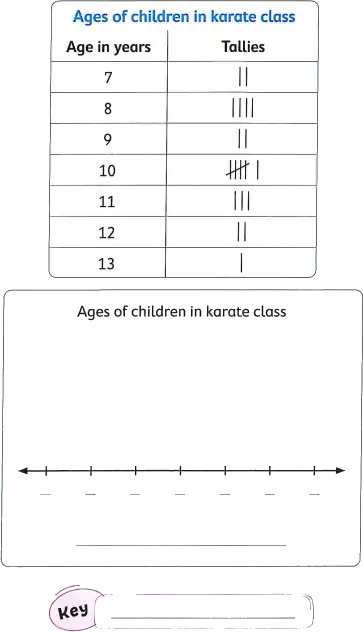
(1) Use the table to draw a line plot.

Use the line plot to answer the questions :
a. How many children in the class are 11 years ? children.
b. What age is the greatest number of children ? years old.
c. How many children are in karate class in all ? children.
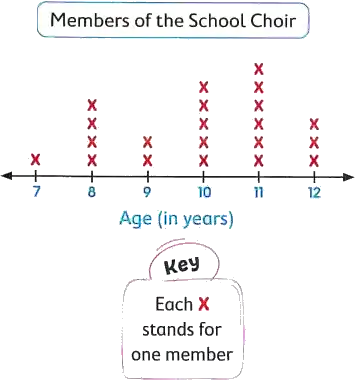
(2) The data in this line plot shows the ages of a group of students in a school choir. The number line shows the ages of the students. Use the line plot to answer the questions.

a. How many students are 8 years old ?
b. How many students are 10 years old ?
c. How many students are 12 years old ?
d. What is the frequency of 11 years in this data ?
e. How many students are in the choir ?
f. How many students are younger than 10 years old ?